
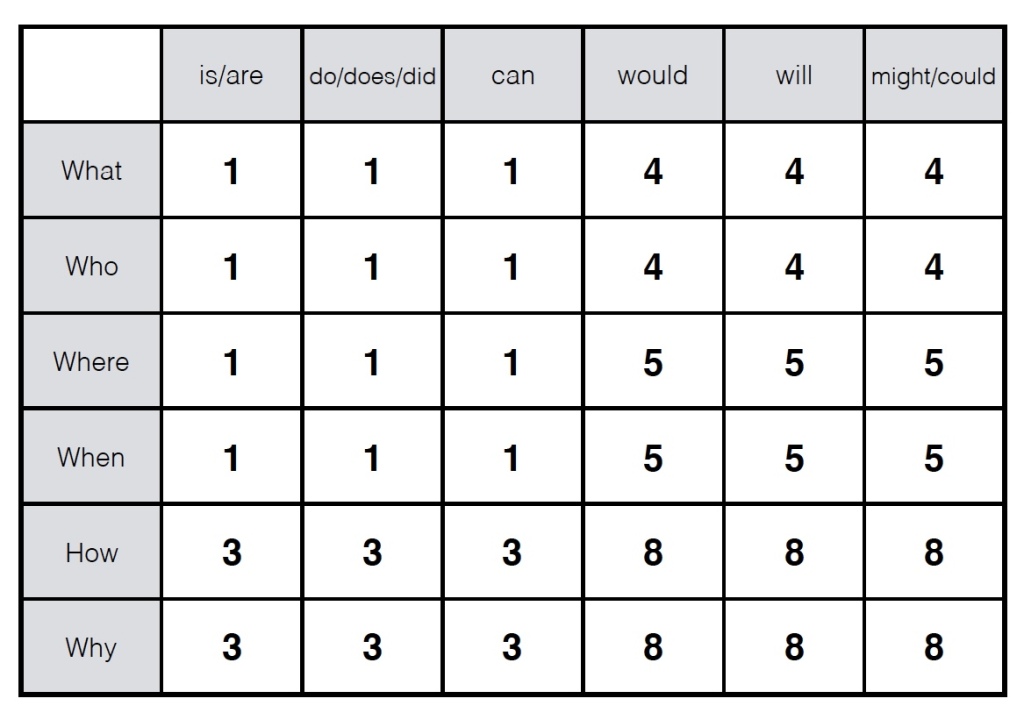
Question charts are excellent tools to help both teachers and students to generate a wide range of questions. You first choose one of the question words on the left column, then a word from the top row, and finally finish the question with a phrase related to the passage you’re reading or the discussion being held.

Most interestingly, the types of questions will be more and more complex the farther down and to the right you move. The blue colour in the chart below, for instance, would belong to questions that ask students to remember factual information from a text; questions in the yellow boxes demand that students analyse the information, draw their own conclusions, or use their prior knowledge; the green boxes invite students to apply the information from the text to new situations and make predictions; and the brown ones, the most demanding, get them to compare and contrast, classify, express an opinion or create something new based on the information provided.

For teachers, a question chart like this can help us to make sure we are asking all types of questions, but starting at B1/B1+ levels students can also use it to generate their own questions when working on reading and listening comprehension, or to plan an oral discussion in class by writing a variety of questions related to the topic beforehand or as the speaking task progresses. We would, of course, be selecting just a few combinations out of the ones available. Once it has been modelled by the teacher and the differences between the questions have been pointed out and practised, students can simply be asked to write at least one question for each area in the grid.
One way to make students aware of the differences between the questions in terms of difficulty is to use a point system and gamify the activity at the same time. The students writing the questions , and even the students answering them, would get those points if they get them right (although we really want them to write all sorts of questions and so certain rules need to be established if we don’t want them to be writing the same types of questions just to get the most points!):
What I really like about charts like this, however, is that it is the students themselves that get to generate the questions, demonstrating comprehension of the written or oral text as they write them, interacting with the text at different levels, or planning a speaking task with all sorts of questions to make it the most engaging. Not only does this improve their comprehension skills and proficiency in English but it develops learner autonomy and it helps to boost their critical thinking skills.
UPDATE 30/05/21
Svetlana Kandybovich from ELT-CATION has turned this question chart into a really useful digital tool in which students play to earn the most points by writing a wide variety of higher-order questions.
Click the picture below to read the full description!


Thank you for sharing this. What a brilliant resource! I’m looking forward to trying it out with my clients.
LikeLiked by 1 person
Helpful.Thanks.
LikeLike
useful!
LikeLike
his is very helpful.
LikeLike
Thank you very much.
LikeLike
A great resource indeed. I was helpless with my students, I think it will be of great help to me.
LikeLiked by 1 person
This is so clear and brilliant for self directed learning … I love it
LikeLike
Great idea! 100% helpful for students
LikeLiked by 1 person
Brilliant source! Thanks a million
LikeLiked by 1 person
This is fabulous! Thanks for sharing, I know I’ll get a lot of use out of this.
LikeLike
Thanks for sharing
LikeLiked by 1 person